Little Red Riding Hood Real Estate Market Update – Fair Housing Month
Happy Fair Housing Month everyone!
.png)
We have a Little Riding Hood real estate market. Some areas are cold, others hot, and some are balanced. Click here to watch the video.
Chandler is a steadily stronger seller's market (much higher demand than inventory), Queen Creek is a worsening buyer's market (a ton more inventory than buyers), and Gilbert is a flat lukewarm seller's market (some more buyers than sellers).
We are heading slowly toward balanced market conditions so the prospect for a rapid rise, or collapse, in prices is minimal any time soon.
Everyone is waiting to see if mortgage rates might fall and spark some buyer enthusiasm. Alas, the rate rollercoaster continues to keep us strapped in our seats while headed for yet another round of twists and turns to make us feel nauseous.
The annual sales (homes sold) rate is now down to the lowest it has been since 2009now that the interest rate is back over 7% freaking AGAIN.
Supply continued to grow during March, which is very unusual for the time of year. However it only grew 2.8% so did not exactly pile up and remains well below normal. Not too much extra competition for sellers and a welcome increase in available choice for buyers.
The only certainty is that either:
we will all get used to the 6-7% interest rates, as we were for most of this nation's history,
or buyers will continue to put their financial future on hold even longer.
Sellers will only sell when they have a large enough reason to; more than what they currently gain from really low interest rates.
Are you considering buying or selling a home? Reply to this email or text me at 602-730-2143.
.png)
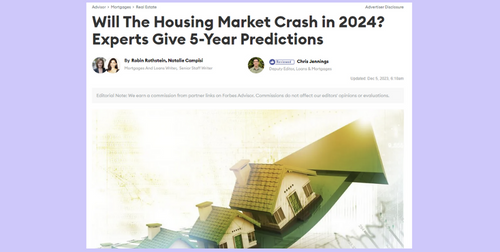
Are we in a HOUSING BUBBLE?
According to this Forbes article, “A bubble has three defining characteristics: price growth is driven by speculation, bubbles are fueled by credit expansion, bubbles pop,” Kiefer says. “While house prices grew at record rates in 2021, the reasons for the increase were not primarily speculation or credit expansion but rather record-low mortgage rates and a fundamental shift in housing demand.”
Since this newsletter is about real estate in the Valley of the Sun, I've taken some liberties to make this about us:
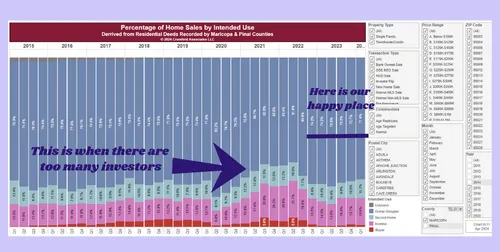
Price growth driven by speculation. Speculators are fix and flippers, REITs, and corporations such as Open Door. As you can see here, corporations have absolutely had a hand in some of the pricing increases in 2021 and 2022. Our happy place is when 70% or more of home sales are used for personal use, meaning not those whose sole purpose is to make a profit. See below.
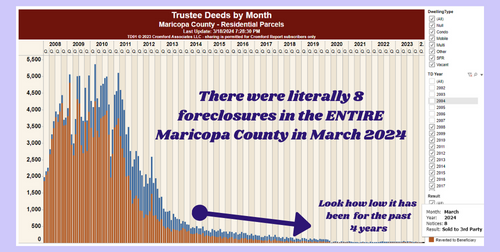
Too much debt on a home is called "belly up," and that sucks rocks. (Very eloquent, I know.) Here are our foreclosure rates. The Trustee Deeds by Month chart above shows a total of 8 foreclosures in ALL of MARICOPA County. (Note: I define "belly up" when a home has more owed on it than the seller could NET if the home is sold on the open market.)
A warm thank you to the Cromford Report, and Tina Tamborer, for her invaluable insights and data for this update.

I'm newly ramping back up on my LinkedIn account. Please follow me for more fascinating REAL ESTATE MARKET content.
When you hear a friend, family member, or co-work mention they are entertaining the idea of buying or selling a home,
pick up your phone call/text me immediately. Let's coordinate the best way for me to reach out and assist them.
Simply reply to this email or call/text me at 602-730-2143.
WebsiteYouTubeInstagramFacebookLinkedIn
Nancy Wittenberg
